User Guide
Introduction
The WebDC3 web interface is primarily a tool for obtaining seismic waveforms. As the name suggests, it offers an easy interactive point-and-click interface which is convenient for when you are exploring the available data, or for smaller requests. But it can be used in a few interesting additional ways too.
There are a couple of ways to use WebDC3:
- Event based - for exploring a catalog of seismic events (earthquakes), or for when you are looking for waveforms recorded near the time of one or more specific events. You can select events by multiple criteria, then pick from channels available at those times.
- Station-based - to explore inventory to see what stations/streams are available and their parameters.
- Time-span based - e.g. for obtaining station metadata over fixed periods of interest.
- To examine the status of your requests.
There is some on-line help available as pop-ups in the [?] box at the top right of each box in the web interface. Clicking on this takes you to the appropriate part of the help page. Also you can click on the link in the top right corner to see the whole help page.
Note
The web interface is highly configurable. Your site operator may customize its appearance in many different ways. The instructions here are written with the GFZ interface in mind, but the basic work flow described below should be applicable to most sites’ implementations.
Using the web interface requires a relatively modern web browser, due to its use of JavaScript. We have used it successfully on:
- Firefox 16 on openSUSE 11, Firefox 7 on Ubuntu 11.04
- Chromium version 27 on openSUSE 11
- Internet Explorer 10 and 11 on Windows 7
- Opera 18 on Windows 7
- Opera 12.16 on Ubuntu 11.04
- Safari/8536 on iPhone OS 6.1.x
Some problems:
- Opera 11.52 on openSUSE 11 - adding stations fails.
It will not work on:
- Internet Explorer 8 or earlier.
Getting started
Visit http://eida.gfz-potsdam.de/webdc3 or your local webinterface site. The screen should look something like this:
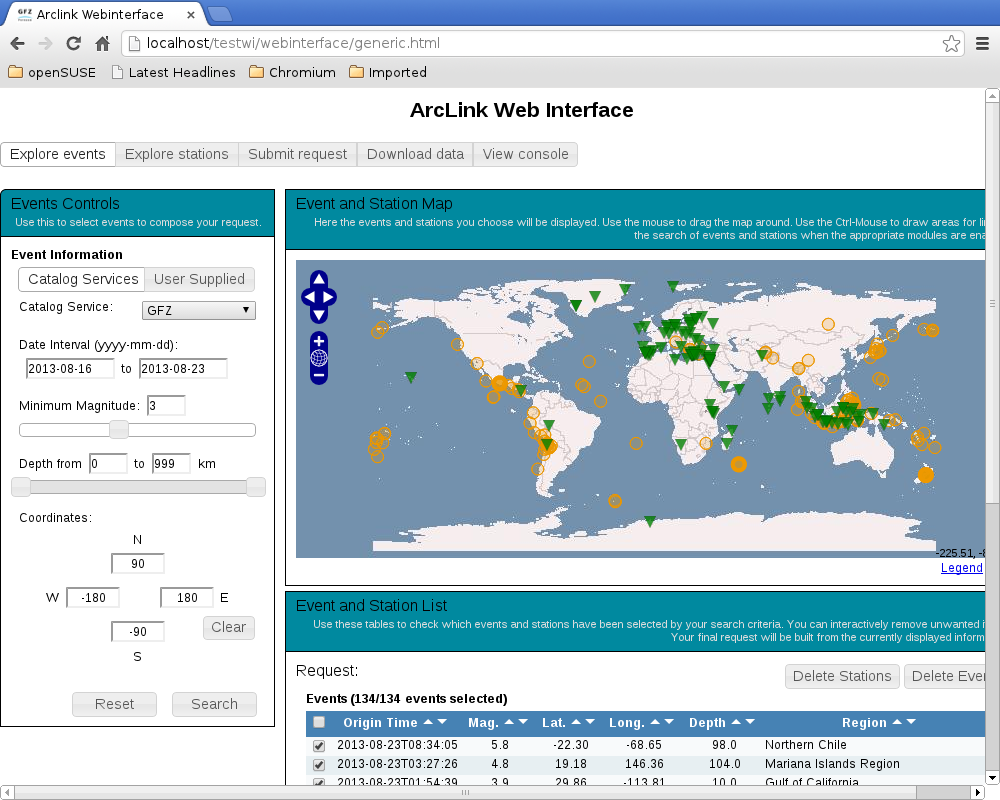
There are different areas visible. Most prominent is the world map which will show stations and events as they are selected. On the left are different “control” boxes to pick stations and events, and submit your data request when you are ready. Below the map is status information and a summary of the stations and events you have selected.
Event-based search
First pick a catalog from the pull-down menu in the “Select stations” area. By default the time period is 7 days Move the start date back a few days. Pick the ‘GFZ’ catalog, and you will see some selectors to constrain your choice of events below the time period area. You can use this to restrict your selection to a particular magnitude range e.g. greater than 5.0. There are selectors for:
- magnitude
- depth
- region - rectangular (today) and circular (planned)
in addition to period of interest. When you are happy, press ‘Submit” in the “Select stations”. Now in the “Display event/station” area you should see a list of events. They are also shown as circular features on the map area. These can be sorted by different criteria (triangle symbols on the top of the table), and selected/deselected as you wish.
Uploading a catalog of events
In addition to the public catalogs you can supply your own list of events. In the “Events Controls” box:
Choose “User Supplied”.
Click “Upload Catalog”. The “Catalog Input Dialog” box appears.
Specify what columns your data is in. You need only provide location (latitude, longitude, depth) and event time.
Paste your catalog data into the text area provided. It can be much longer than fits in the box.
Note
The parser attempts to determine what separator and quoting conventions were used for your input, and accommodate them, but this is not always effective. If there were problems, they should be reported on the console (click the “View console” tab at the top of the page). If possible, use comma (‘,’) as a separator, and quote any text strings, including the date-time string.
Note
The parser attempts to be lenient in interpreting your data. But date-times should be like:
YYYY-mm-ddTHH:MM:SSor you will run into problems. Also to avoid confusing the sniffer, make sure your data is consistently formatted from one row to the next. The parser also accepts a header row. If one or more rows in your CSV data are unacceptable, they will be ignored, silently. In this case you will see zero events in the Event and Station List box.
Click “Send” in the “Catalog Input Dialog” box. There is an acknowledgment pop-up. Maybe: click “Search” in the “Events Controls” box to load your submission. If parsing was successful, you will see your events on the map and in the “Event and Station List”.
Stations/channels search
In the “Explore stations” tab you are able to explore and select the available stations and channels. There are different possibilities to filter the stations and channels. To follow them in top-bottom order (as they appear on the web page) is recommended, but it is not mandatory.
Start by choosing a time range in years with the double slider at the top. The default values are 1980 [2] and the current year, which covers the whole range of operation. When you change the time selection, the drop-down lists are updated to show the available information only for this time range.
You can then refine by specifying the network type, and/or a particular network.
When you want to select the stations there are three different ways to do it.
- by station code: You can use the drop-down list to select one particular station or all of them.
- by geographic region: You can enter the minimum and maximum latitude and longitude to define a rectangular area. In this case, all the stations located inside this area, and that also meet the other selection criteria, will be selected. The rectangular area can also be selected in the map, by pressing the left “Shift” and dragging the mouse over the map.
- by events: If you have already selected at least one event (it should be visible on the list under the map) you can select stations located within a certain distance (in degrees) and azimuth of an event.
To further select/filter the desired streams you have two options:
- by code: Just click on the list of streams you would like to request. You can also used the “Shift” and “Ctrl” keys to make multiple selections.
- by sampling rate: With the slider control, select the preferred sample rate that you want to get from the station. The web interface will return the channels which are closest to the preferred sampling rate. This means that at least one channel will be retrieved per station.
Once the filter criteria are entered, you can click on “Search” and the resulting list of stations/channels will appear in the list below the map.
After you have made one selection, you may append additional stations (use the “Append” button, where the “Search” button was before you made a selection). Or you may replace your selection using the “Delete Stations” button on the “Event and Station List”.
[BUG, October 2013: Appending extra streams to an existing set of stations
doesn't work e.g. FR HH streams are already selected, and now you'd like to
add LH streams.
The workaround is to select both sets of streams using the streams "by Code"
selector on the Station Controls.]
Further filtering
If you take a look at the top of the “Stations list” you will see a small “Filter” button on the right part. When you click on it, you are presented a summary of the available Location, Sampling, Instrument and Orientation Code. By default, everything is checked and you can use these check boxes to further filter the channels you want in your request. For instance, if in “Orientation Code” you left just “Z” checked you will include only the channel associated with the vertical component.
Note
Remember that you need to click again on “Filter” for your changes to take place.
You can also use the check boxes at the left of every line (station) to select all the stations that you want and click on “Freeze” to remove all the unchecked stations from the list.
When you finished selecting all the information related to events and stations you can go to the “Make Request” control using the “Submit Request” tab.
Request types
There are two different types of information that you can get from this system:
- waveform data: there are two formats in which you can download, mini-SEED and full SEED.
- inventory metadata: there are also two formats in which you can download the information, dataless SEED and ArcLink Inventory XML.
In order to be able to create any type of request you need to have at least one channel selected.
Making a request
On the “Submit Request” tab, you must first select the request type. You may enable bzip2 compression. Compression is recommended for text-based formats like dataless SEED and XML. In the case of dataless and full SEED, you can elect to use a response dictionary; this makes SEED metadata of some networks substantially smaller, but may cause compatibility problems.
Next you can select an absolute or relative (to P and S waves) time window. If you haven’t selected any events, then the absolute mode is the only choice, otherwise you almost certainly want to use the relative mode.
Finally click “Review” or “Submit”. “Review” opens an additional pop-up window, where further adjustments to the final request can be made. Clicking “Submit” skips this review step.
At this point, it is checked whether the request size is within configured limits. If the check is passed, multiple Arclink requests are created and routed to different data centers. WebDC refers to this set of Arclink requests corresponding to a single submit action as a “request group”.
Status/download
On the “Download data” tab, in the “Recent Requests” box, you should now see a line corresponding to the request group created during the previous step. Once routing is complete, you can click on the line to open a pop-up showing the status of the request group.
Sometimes copies of data are stored in multiple data centers; in this case there are multiple routes to the data. If the first route returns no data, it is possible to reroute the request to the next data center.
The following buttons are attached to each request group:
- Reroute: tries to send all lines with NODATA and RETRY status to alternative data centers if possible. If there are no (more) alternative routes, you’ll see “No more routes found” on the console.
- Retry: same as Reroute, except that lines with RETRY status are sent to the same data center again.
- Resend: send the same request group again. This might be helpful if there are transient errors. Note that the re-sent request does not include lines which could not be routed originally because no routes were found (those lines are not part of the request group).
- Delete: deletes the request group in all data centers involved.
- Refresh: contacts the server(s) to update the processing status of the request group. If you click here during a big request, you will likely see the number of “PROCESSING” lines increase and the number of “UNSET” lines decrease.
In the “Manage Requests” box, you can display the status of all requests associated with your user ID (currently, e-mail address) in all EIDA data centers. Here you also have the option of downloading all data volumes with a single click if you have jDownloader running.
Note
You can get jDownloader from <http://jdownloader.org/>. We recommend that you avoid the Windows exe installer and to use the MULTIOS zip instead. You can execute the jar file directly using “java -jar -Xmx512m JDownloader.jar”.
Limitations
Using WebDC3 you can generate requests which involve many time windows for many streams/channels. These large requests may be rejected by the underlying Arclink server. In this case you will see an alert box.
At GFZ, the current limits are
- 500 events
- 10000 total request lines (traces)
The web interface can break large events up into chunks, but it is still possible for very large requests to exceed limits.
Footnotes
| [2] | Remember, the web interface sits on top of Arclink, and Arclink inventory generally begins on 1 January 1980. |